
YouTube Audience Growth Is Up +49 Percent Over Twelve Months, According to Touchstorm's VideoAmigo Software
NEW YORK, NY, June 27, 2017 (Newswire.com) - Touchstorm, using its VideoAmigo software, today announced that for the month ending May 2017, YouTube viewing was up +3.13 percent vs. April, with views from the United States up +2.53 percent.
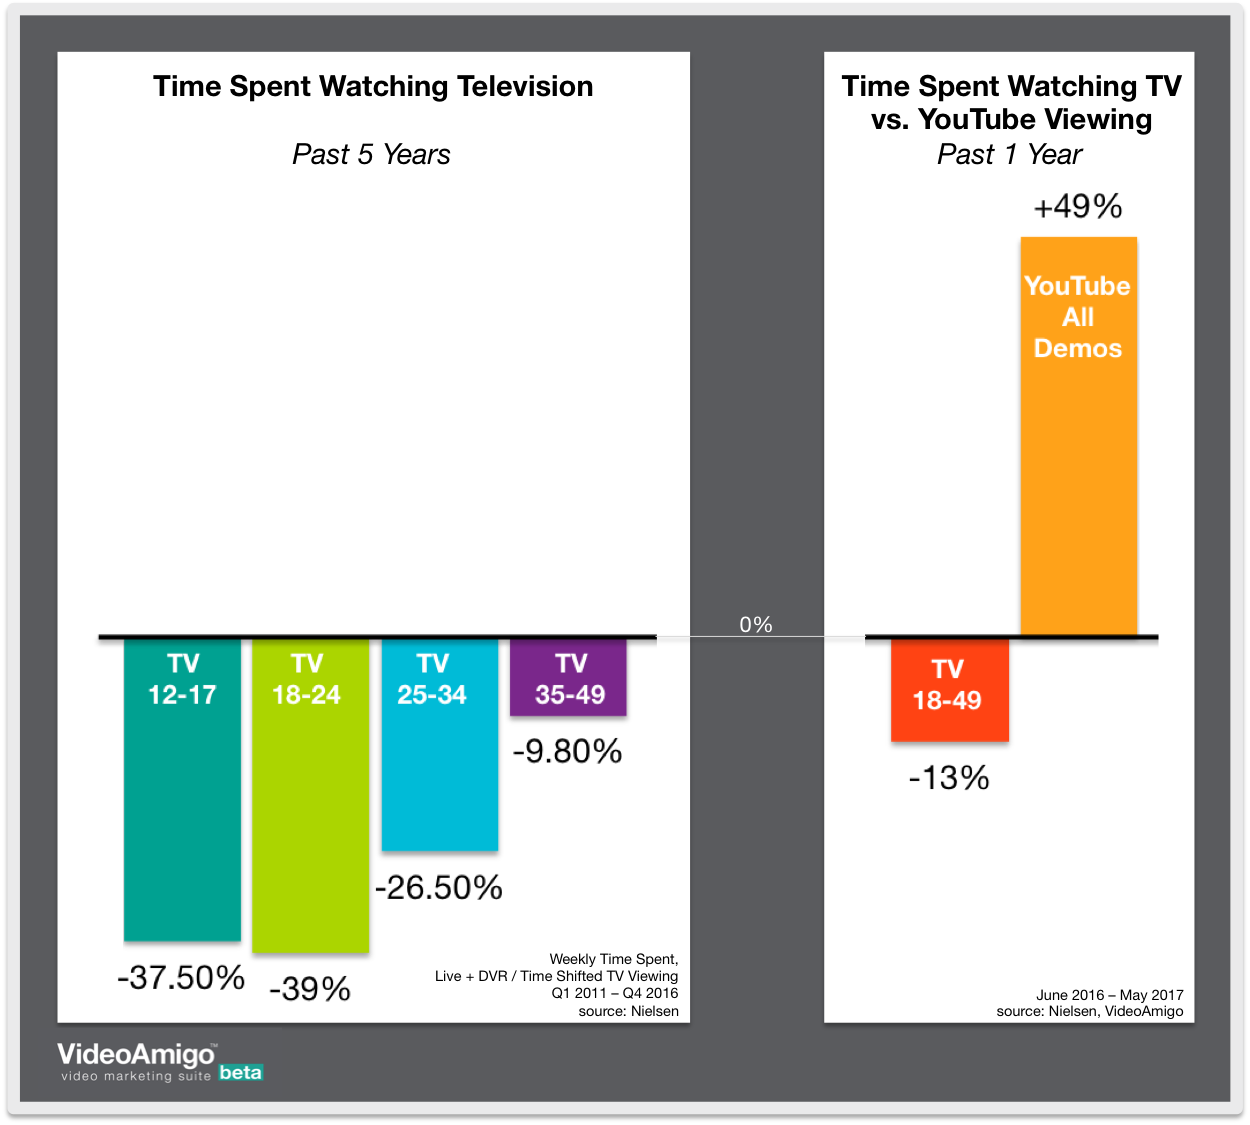
Despite YouTube's ever-growing global base — which makes an increasing growth rate harder to achieve — YouTube has racked up a compound growth rate of just over +49 percent for the twelve-month period that ended May 31. During the same period, TV viewing dropped by -13 percent in the United States for the key 18-49 demographic, per Nielsen. VideoAmigo's interactive YouTube Growth Charts charts are available at videoamigo.com/youtube-growth.
"The reason why YouTube and television are rarely (if ever) directly compared is because parallel metrics haven't been available," said Alison Provost, CEO of Diginary Holdings, parent company to Touchstorm and VideoAmigo. "Until now, there hasn't been a 3rd party database large enough to look at YouTube's big picture with reasonable statistical surety." Provost continued, "Still, the comparison can only be done against two different but reasonably comparable metrics."
In the chart attached, Nielsen numbers are based on U.S. weekly time spent with television against various demographics (using Nielsen's C3 metric, which includes live TV plus three days of time-shifted viewing). YouTube numbers include all demographics globally and are based on total monthly views. Ultimately, these two statistics do reveal a singular big picture: that time spent with TV is going down, and time spent with YouTube is going up.
Ajoy Thomas, VideoAmigo's Chief Technology Officer, added: "We're looking at 13 million YouTube channels and nearly a billion pieces of video content daily. As we add channels and content to our database, we calculate YouTube's growth on a 'same store sales' basis to ensure that new additions aren't counted as growth." Provost added, "As our sample size continues to grow and as even more creators register with us to use the free tools, we'll be able to publish this information on demographics too, which will make YouTube more directly comparable to TV."
May 2017
YouTube View Growth
CATEGORY* |
% GROWTH |
|
LANGUAGE |
% GROWTH |
|
COUNTRY |
% GROWTH |
Home |
3.43% |
Hindi |
6.24% |
India |
6.60% |
||
Society |
3.24% |
Vietnamese |
5.39% |
Philippines |
4.49% |
||
Entertainment |
3.16% |
Turkish |
4.85% |
Brazil |
3.84% |
||
All Marketing Categories |
3.13% |
Portuguese |
4.31% |
Korea, South |
3.55% |
||
Cooking & Entertaining |
3.02% |
Thai |
4.24% |
Argentina |
3.25% |
||
The Arts |
3.01% |
Arabic |
3.91% |
All Countries |
3.13% |
||
Sports |
2.92% |
Korean |
3.87% |
Mexico |
2.94% |
||
Technology & Science |
2.77% |
Spanish |
3.53% |
Russia |
2.93% |
||
Self-Care |
2.67% |
Russian |
3.20% |
Spain |
2.62% |
||
Travel & Transportation |
2.62% |
Chinese |
3.18% |
Japan |
2.55% |
||
Education & Business |
2.19% |
All Languages |
3.13% |
United States |
2.53% |
||
Hobbies |
2.04% |
Romanian |
3.02% |
France |
2.51% |
||
Greek |
2.95% |
Canada |
2.39% |
||||
French |
2.94% |
Ireland |
2.39% |
||||
Japanese |
2.81% |
Italy |
2.37% |
||||
Italian |
2.80% |
Poland |
2.30% |
||||
English |
2.78% |
United Kingdom |
2.27% |
||||
Polish |
2.54% |
Netherlands |
2.11% |
||||
German |
2.20% |
Germany |
2.06% |
||||
Czech |
2.11% |
Australia |
1.95% |
||||
Dutch |
1.83% |
Sweden |
1.70% |
*VideoAmigo Marketing Categories are not the same as YouTube categories as VideoAmigo has re-imagined them for enhanced precision.
YouTube Growth
Long Term Trends
BY MARKETING CATEGORY
- For the 13th month in a row, the marketing category "Home" beat YouTube overall growth rates. (In VideoAmigo, "Home" includes sub-categories: Family Life, Dwellings & Property, Kids' Stuff, Money & Legal, Pets & Animals.)
- For the fourth consecutive month, "Society" also outpaced YouTube overall growth rates. (In VideoAmigo, "Society" includes sub-categories: Activism & Issues, History & Social Science, News / Government / Military, Social Life / Community & Cultures.)
BY LANGUAGE
- Channels primarily posting in these languages all out-paced general YouTube growth rates for four or more consecutive months: Spanish (13 months in a row), Turkish (13), Vietnamese (13), Portuguese (12), Hindi (11), Thai (11), Korean (8), Arabic (7), and German (4).
BY COUNTRY
- Channels based in these countries have outpaced general YouTube growth rates for four or more consecutive months: Brazil (12 months in a row), The Philippines (12), and India (10).
"It all adds up to a decision that many brands have to make about YouTube," Provost concluded. "Touchstorm brand customers trying to reach 12-44s tell us they are absolutely stumped. These demos just can't be reached on TV for reasonable budgets. And, if the brand has temporarily pulled off of YouTube due to brand safety concerns, then that brand is completely deprived access to broad-reach advertising. We're asking ourselves, what should trump: the need for reach and effectiveness, or the fear of brand safety? Especially since there are many companies — ours included — that offer solutions to the brand safety problem."
About Touchstorm and VideoAmigo
Touchstorm (www.touchstorm.com) is a tech-enabled services company that builds social media audiences for global brands. VideoAmigo (www.videoamigo.com) is the world's largest social media database and analytic platform for social creators and brands with free self-serve tools that help users Rise Above Your Rivals™.
Touchstorm, LLC and VideoAmigo are owned by Diginary Holdings, headquartered in New York and Richmond, with global employees serving clients around the world in twelve languages.
About Diginary Holdings
Diginary Holdings is self-funded and women-owned. Touchstorm is certified as a women's business enterprise by the Women's Business Enterprise National Council (WBENC). Company clients include Craftsman Tools, COVERGIRL, JCPenney, Pampers, YouTube, Gillette, StandUp2Cancer, Max Factor, Enfamil, Vineyard Vines, KIND, YETI Coolers, Clairol, and Kenmore.
In a world where data-rich marketing SaaS platforms abound, Diginary found its brand clients unable to use that data to create marketing insights. Deciding that the missing link was comparative information, the company created the Touchstorm Video Index (TVi®), placing virtually every Google search query, social media channel, and a billion pieces of social content into 5,500+ nested marketing categories. The results: competitive consumer insights and historical proof of what content and placements will work to grow an audience in any given category. Touchstorm uses the most advanced data to deliver audience wins for brand clients, and a portion of this data is available in the self-serve VideoAmigo platform, free.
Media Contact:
Touchstorm
Stacy A. Sarna
stacy@touchstorm.com
877-361-5700
Source: Touchstorm
Share: